

Intro
Solving Volunteer Training Challenges Infographic
I worked with a team of five designers to create a wearable infographic that helps volunteers sort produce quickly, consistently, and safely.
Role
Product Designer and UX Researcher
Field Research
Field Research
Immersive Observations
We worked alongside volunteers during sorting shifts to see real behavior, timing, and constraints. Watching actual workflows showed where decisions slowed, where mistakes occurred, and what information volunteers lacked in the moment.
In-Context Interviews
Short conversations on the line captured volunteers' decision logic, common questions, and real-time frustrations without interrupting their work.
Insights
Insights
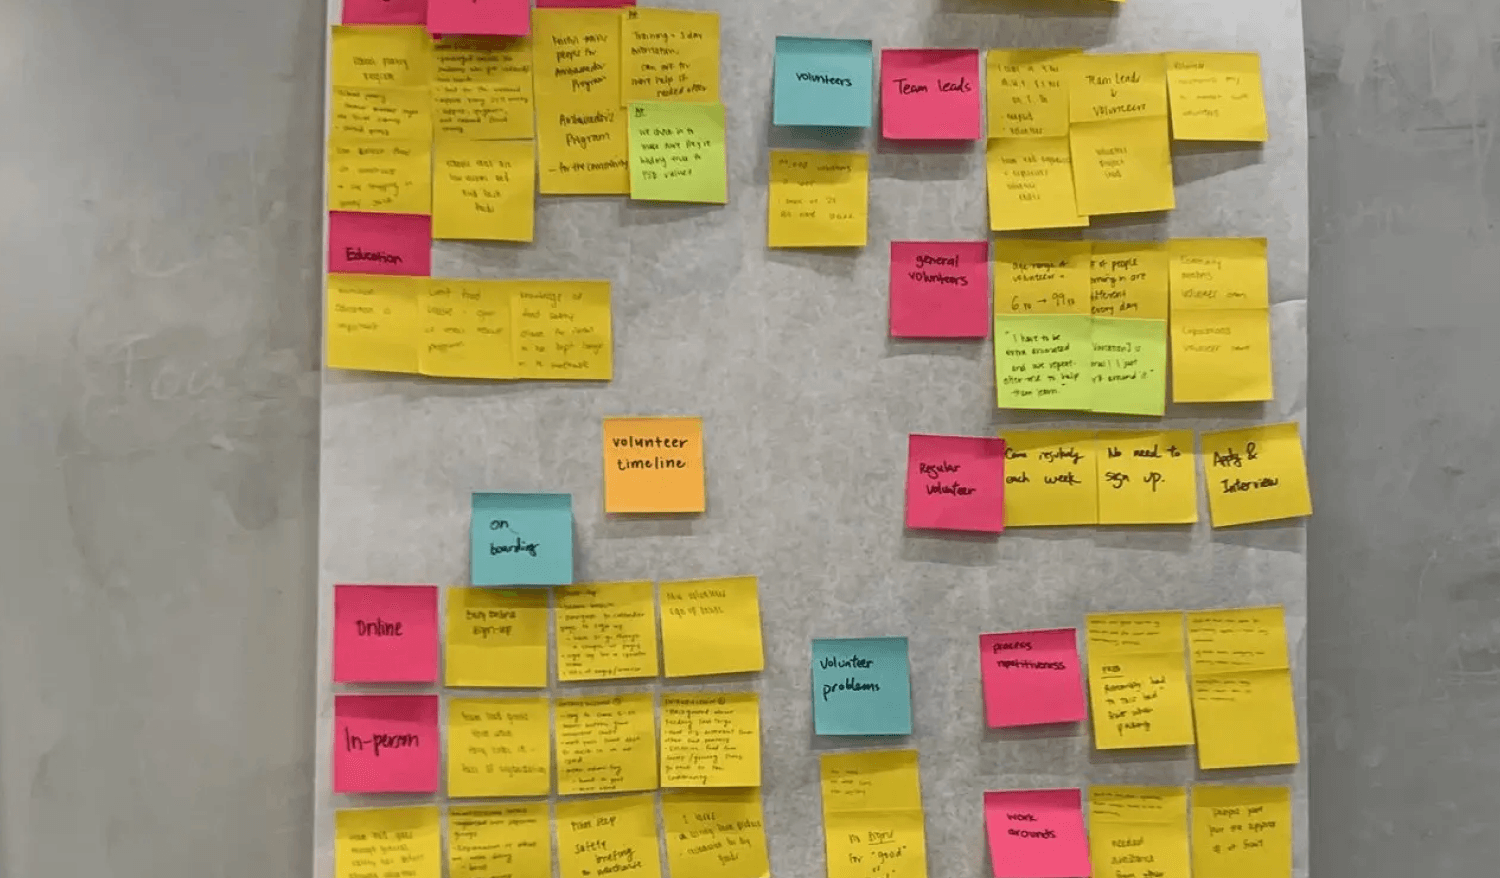
Research Synthesis
We built an affinity diagram that grouped observations into three areas: the volunteer timeline, volunteer types, and common challenges. That made patterns obvious and helped the team agree on what to prioritize.
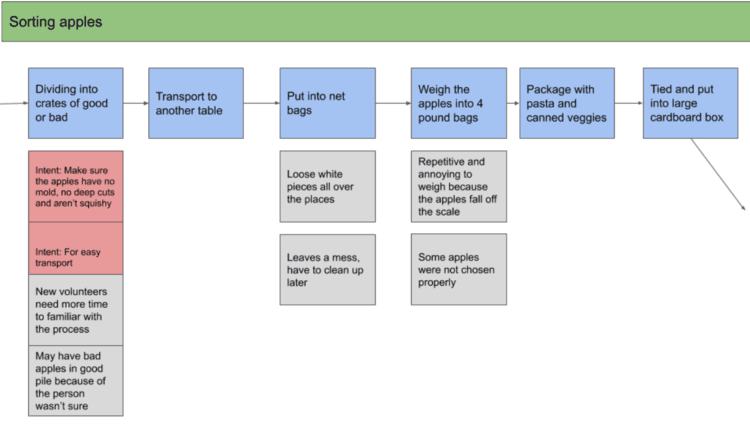
Mapping the Volunteer Journey
We mapped every step from onboarding to offboarding and noted how volunteers felt at each stage. This exposed a central problem: new volunteers lacked confidence when sorting. With little guidance they often hesitated or discarded edible food, slowing the process.
Problem statement
Problem statement
Volunteers sort produce in a fast-paced operation with minimal training, causing inconsistent outcomes: edible items are sometimes discarded, unsafe items occasionally pass through, and standards vary by volunteer.
Key Personas
Key Personas
Understanding Our Users
Volunteers represented a diverse group with varying experience levels but shared the common goal of ensuring food reaches those who need it most.

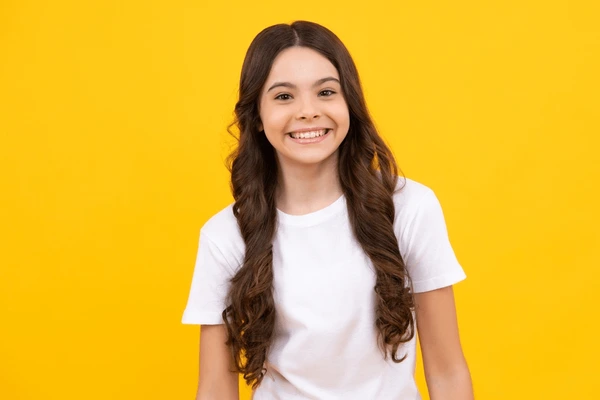

Ginny Baker
Student, 12 years old
As a first-time volunteer, I need guidance so I can sort without constantly asking for help.
User needs
User needs
Make expert sorting rules immediately available and easy to apply at the moment of decision so volunteers of any experience can sort quickly, consistently, and safely.
Ideation
Ideation
Design Strategy
We used rapid ideation and storyboarding to explore solutions. The key insight: volunteers need guidance at the exact moment they make a sorting decision. Early sketches tested wall posters and apron infographics that use simple visual storytelling to show "good" vs. "bad" produce.


Infographic poster and apron showing visual contrasts between good and bad produce (no mold, no deep cuts, not squishy)
First Iteration
First Iteration
Wall-Mounted Poster Guide
Design approach - Posters showing one apple with all three problems: mold, cuts, and squishiness
What we found - Volunteers rarely looked away from their stations to read posters, and the designs were too cluttered to process quickly
Key learning - Guidance must sit in volunteers' immediate field of view and present clear messages


Realistic vs. cartoon illustrations highlighting mold (black/gray/white fuzz), squishiness (soft when pressed), and deep cuts (can harbor bacteria)
Second Iteration
Second Iteration
Wearable Reference with Photo Realism
Design approach - Apron infographics with photographic examples of good vs. bad produce
What we found - Real produce varies too much, slowing volunteer decisions
Key learning - Abstract representations enable faster recognition and broader applicability


Infographic on apron comparing minor bruises and small cuts (good) with moldy, squishy, or severely cut produce (bad)
Final Iteration
Final Iteration
Abstract Visual Guide with Clear Messaging
We used simple illustrations that highlight behavior-based cues rather than exact appearances, so volunteers can recognize problems quickly across many produce types.
- Simple Rule - "If ___, then it's bad"
- Memorable - short catchphrases volunteers can say and recall
- Actionable criteria - severe cuts (exposed flesh), visible mold (fuzzy growth), and squishy/soft texture (breaks under light pressure).
- Universal - applies to all produce types and supports quick, consistent sorting


Wearable poster on apron with "If ___, then it’s bad" framework illustrating severe cuts, mold, and squishy texture
Results & Impact
Results & Impact
A wearable infographic closed the gap between team leads and new volunteers—eliminating sorting confusion, standardizing safety criteria, and reducing food waste.
Conclusion
Conclusion
By integrating users at every step, we developed a practical solution that serves volunteers.